Scatter plots and lines of best fit worksheet – Grade 9
Questions at easy, medium and hard levels. Pick a level and get a fresh set every time, with instant feedback.
How to solve scatter plots and lines of best fit questions
Learn it A line of best fit follows the trend of the points. Use two points on the line to find its equation, then predict. The slope tells you the rate in real terms.
Example: A fit passes through (2, 30) and (6, 50).
- Slope = (50 − 30) ÷ (6 − 2) = 5.
- y = 5x + 20.
- At x = 10, y = 70.
Loading questions…
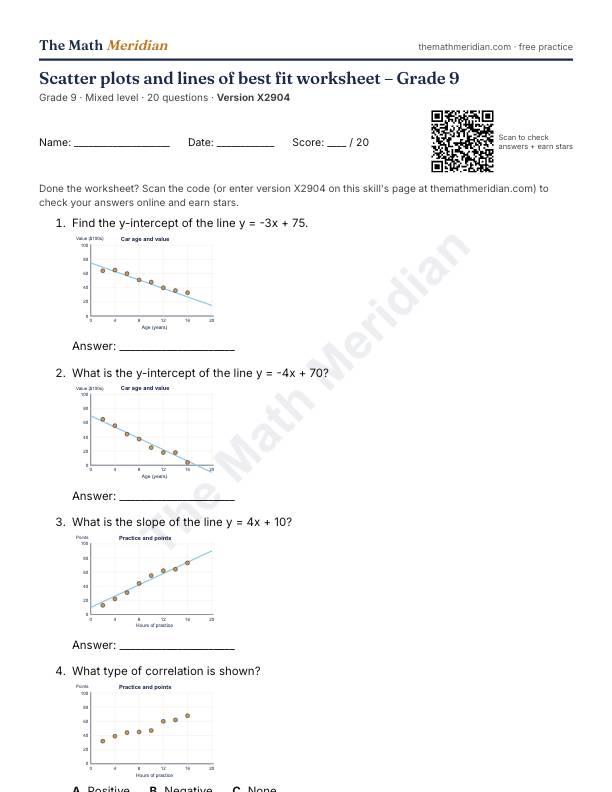
Free printable PDF: Scatter plots and lines of best fit worksheet (Grade 9)
20 questions from easy to hard, with an answer key on the last page. Print it, then scan the QR code on the sheet to check the answers online and earn stars.
Download the PDF worksheetWant a different version? Use Printable worksheet above for a new set of questions every time.
Worked examples: Scatter plots and lines of best fit
Try each one first, then open the solution.
-
Easy
The line of best fit is y = 3x + 30. Predict y when x = 16.
Show the solution
Answer: 78
3 × 16 + 30 = 78.
-
Medium
A line of best fit passes through (6, 27) and (14, 43). What is its slope?
Show the solution
Answer: 2
(43 − 27) ÷ (14 − 6) = 2.
-
Hard
Sales of umbrellas and of raincoats rise together. Does one cause the other?
Choices: No, rainy weather affects both · Yes, umbrellas cause raincoats · Yes, raincoats cause umbrellas · They are unrelated
Show the solution
Answer: No, rainy weather affects both
Correlation does not prove causation.