Box plots, histograms and skew worksheet – Grade 10
Questions at easy, medium and hard levels. Pick a level and get a fresh set every time, with instant feedback.
How to solve box plots, histograms and skew questions
Learn it The shape of data tells a story. A long tail to the right is right-skewed, and the mean sits above the median. For skewed data, report the median and IQR.
Example: House prices have a long tail to the right.
- A few very expensive homes pull the mean up.
- The median is more typical.
- Report the median.
Loading questions…
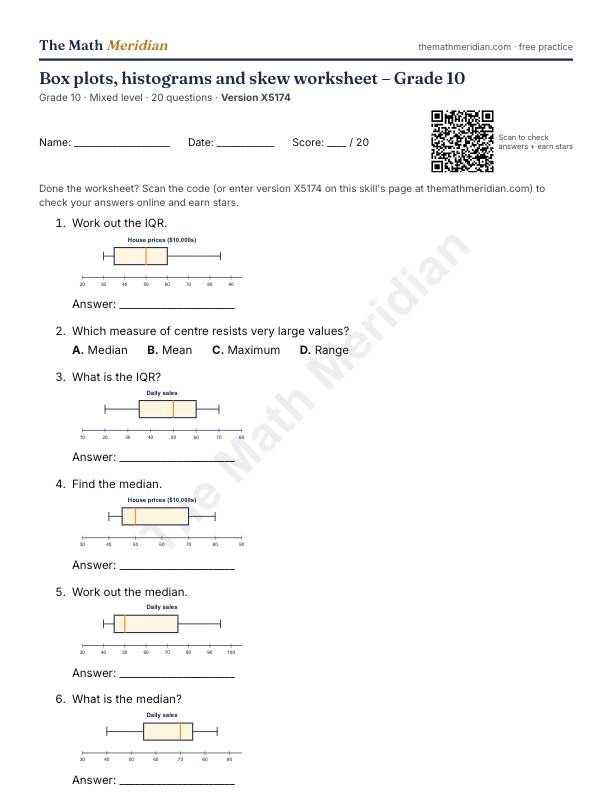
Free printable PDF: Box plots, histograms and skew worksheet (Grade 10)
20 questions from easy to hard, with an answer key on the last page. Print it, then scan the QR code on the sheet to check the answers online and earn stars.
Download the PDF worksheetWant a different version? Use Printable worksheet above for a new set of questions every time.
Worked examples: Box plots, histograms and skew
Try each one first, then open the solution.
-
Easy
Which measure of centre resists very large values?
Choices: Median · Mean · Maximum · Range
Show the solution
Answer: Median
Only the middle position matters.
-
Medium
A data set is right-skewed. Which is usually true?
Choices: Mean > median · Mean < median · Mean = median · Mean = 0
Show the solution
Answer: Mean > median
The long right tail pulls up the mean.
-
Hard
Is 119 an outlier here, using Q3 + 1.5 × IQR?
Choices: Yes · No
Show the solution
Answer: Yes
The fence is 117.5.