Graphs of trigonometric functions in radians (including sec, csc and cot) worksheet – Grade 12
Questions at easy, medium and hard levels. Pick a level and get a fresh set every time, with instant feedback.
How to solve graphs of trigonometric functions in radians (including sec, csc and cot) questions
Learn it For y = a sin(k(x − d)) + c or y = a cos(k(x − d)) + c in radians: amplitude |a|, period 2π ÷ |k|, phase shift d, axis y = c, maximum c + |a| and minimum c − |a|. y = tan(kx) and y = cot(kx) have period π ÷ |k|. y = sec(kx) and y = csc(kx) have period 2π ÷ |k|, with vertical asymptotes where cos(kx) = 0 (sec, tan) or sin(kx) = 0 (csc, cot).
Example: Find the period and maximum value of y = 3 sin(4(x − π/8)) + 1.
- Period = 2π ÷ 4 = π/2.
- Maximum = 1 + 3 = 4.
Loading questions…
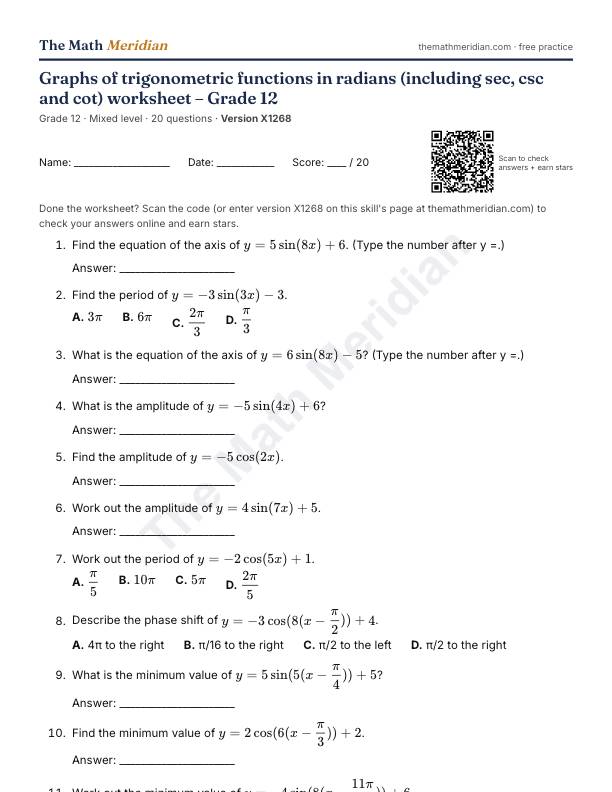
Free printable PDF: Graphs of trigonometric functions in radians (including sec, csc and cot) worksheet (Grade 12)
20 questions from easy to hard, with an answer key on the last page. Print it, then scan the QR code on the sheet to check the answers online and earn stars.
Download the PDF worksheetWant a different version? Use Printable worksheet above for a new set of questions every time.
Worked examples: Graphs of trigonometric functions in radians (including sec, csc and cot)
Try each one first, then open the solution.
-
Easy
Work out the amplitude of $y = 4\sin(3x) - 3$.
Show the solution
Answer: 4
The amplitude is |a| = |4| = 4.
-
Medium
Describe the phase shift of $y = 6\sin(2(x - \frac{\pi}{2})) - 2$.
Choices: π/2 to the right · π to the right · π/4 to the right · π/2 to the left
Show the solution
Answer: π/2 to the right
In the form y = a sin(k(x − d)) + c, the phase shift is d = π/2 to the right. Factor out k first.
-
Hard
Find the first vertical asymptote of $y = \csc(3x)$ for x > 0.
Choices: $x = \frac{\pi}{12}$ · $x = \frac{2\pi}{3}$ · $x = \frac{\pi}{3}$ · $x = \frac{\pi}{6}$
Show the solution
Answer: $x = \frac{\pi}{3}$
sin(3x) = 0 first happens at x = π/3 for x > 0.
🧰 Try it hands-on: Meridian Graph. Graph it on our free graphing calculator and drag the sliders to see how it changes.