Choose the best graph worksheet – Grade 5
Questions at easy, medium and hard levels. Pick a level and get a fresh set every time, with instant feedback.
How to choose the best graph
Learn it Line graphs show change over time. Bar graphs compare groups. Circle graphs show parts of a whole. Line plots and stem-and-leaf plots show how numbers are spread out.
Example: A class wants to show the temperature every hour for a day.
- This is one thing changing over time.
- A line joins each reading to the next.
- Best choice: a line graph.
Loading questions…
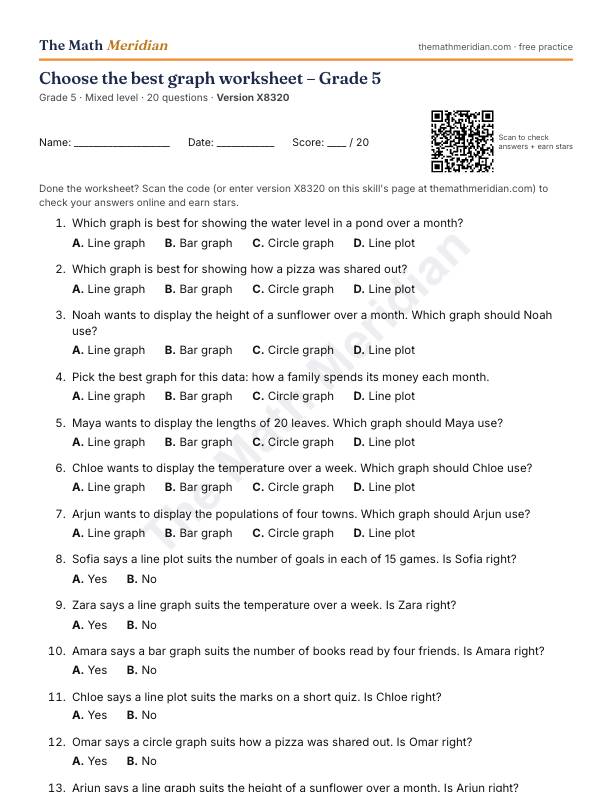
Free printable PDF: Choose the best graph worksheet (Grade 5)
20 questions from easy to hard, with an answer key on the last page. Print it, then scan the QR code on the sheet to check the answers online and earn stars.
Download the PDF worksheetWant a different version? Use Printable worksheet above for a new set of questions every time.
Worked examples: Choose the best graph
Try each one first, then open the solution.
-
Easy
Which graph is best for showing the number of books read by four friends?
Choices: Line graph · Bar graph · Circle graph · Line plot
Show the solution
Answer: Bar graph
It compares separate groups.
-
Medium
Which graph shows change over time best?
Choices: Line graph · Bar graph · Circle graph · Line plot
Show the solution
Answer: Line graph
It shows change over time.
-
Hard
A bar graph's scale starts at 90 instead of 0. What can this make the graph do?
Choices: Make small differences look large · Make all the bars equal · Change the data · Show parts of a whole
Show the solution
Answer: Make small differences look large
Starting above 0 cuts off most of each bar, so gaps look bigger than they are.