Double bar graphs worksheet – Grade 5
Questions at easy, medium and hard levels. Pick a level and get a fresh set every time, with instant feedback.
How to solve double bar graphs questions
Learn it A double bar graph compares two groups side by side. Use the key to see which colour is which group, then read one bar at a time.
Example: In Grade 5, Morning is 30 and Afternoon is 20.
- Check the key for each colour.
- Read the bars: 30 and 20.
- Difference: 10.
Loading questions…
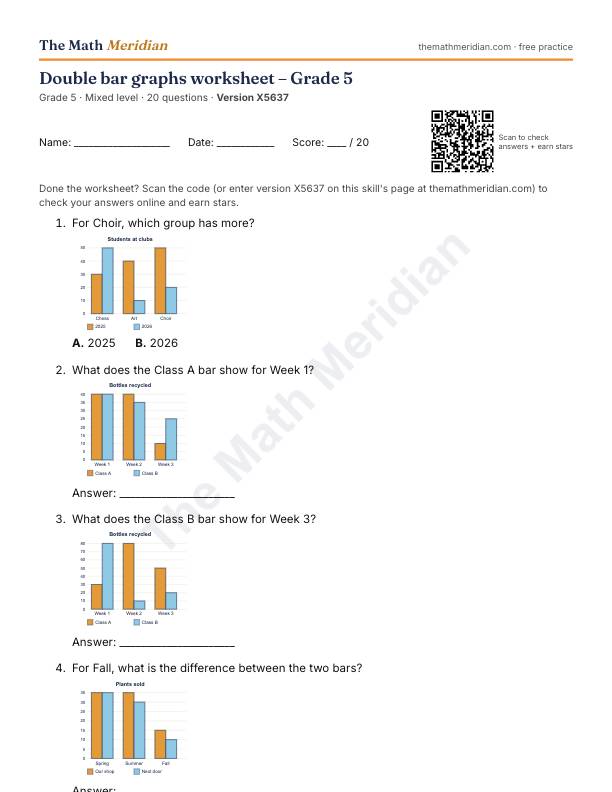
Free printable PDF: Double bar graphs worksheet (Grade 5)
20 questions from easy to hard, with an answer key on the last page. Print it, then scan the QR code on the sheet to check the answers online and earn stars.
Download the PDF worksheetWant a different version? Use Printable worksheet above for a new set of questions every time.
Worked examples: Double bar graphs
Try each one first, then open the solution.
-
Easy
What does the 2026 bar show for Art?
Show the solution
Answer: 40
Find Art, then the 2026 bar: 40.
-
Medium
What is the total for Gr 4, both groups together?
Show the solution
Answer: 75
40 + 35 = 75.
-
Hard
Where is the gap between the two bars the biggest?
Choices: Spring · Summer · Fall
Show the solution
Answer: Spring
The gaps are 30, 20, 15. The biggest is 30.
Double bar graphs: questions parents ask
What is a double bar graph?
A double bar graph shows two sets of data on one graph. Each category has a pair of bars side by side, one for each group, and a key (legend) shows which colour stands for which group. It makes it easy to compare the two groups, for example boys and girls, or this year and last year.
How do you read a double bar graph?
Start with the title and the label on each axis. Check the key so you know which bar is which group, then check the scale: how much each grid line is worth. Read across from the top of each bar to the scale. To compare, find the difference between the two bars in a category. To find a total, add the bars you need.
How do you make a double bar graph?
Give the graph a title and label both axes. Choose a scale that starts at 0, goes up in equal steps and fits the largest number. For each category draw the two bars side by side, leave a gap before the next category, and colour each group the same way every time. Finish with a key.
What is the difference between a bar graph and a double bar graph?
A bar graph shows one set of data, with one bar for each category. A double bar graph shows two sets of data, with two bars for each category, so the groups can be compared category by category. It always needs a key.
What do Grade 5 students do with double bar graphs?
They read values from the graph, compare the two groups, find differences and totals, choose a sensible scale and make their own double bar graphs from a table of data. Questions often ask which category had the biggest difference, or what the graph shows about the two groups.
Is this double bar graph worksheet free, with answers?
Yes. The printable PDF worksheet comes with an answer key, and the online practice gives instant feedback at easy, medium and hard levels. Both are free, with no sign-up.