Choose the best graph and spot misleading graphs worksheet – Grade 6
Questions at easy, medium and hard levels. Pick a level and get a fresh set every time, with instant feedback.
How to choose the best graph and spot misleading graphs
Learn it Choose a graph that fits the data: line graphs for change over time, bar graphs to compare, circle graphs for parts of a whole, histograms for grouped numbers. A fair graph starts at 0 and has equal steps.
Example: A bar graph's scale starts at 50 instead of 0.
- Bars of 52 and 54 look very different.
- The real gap is only 2.
- The graph is misleading.
Loading questions…
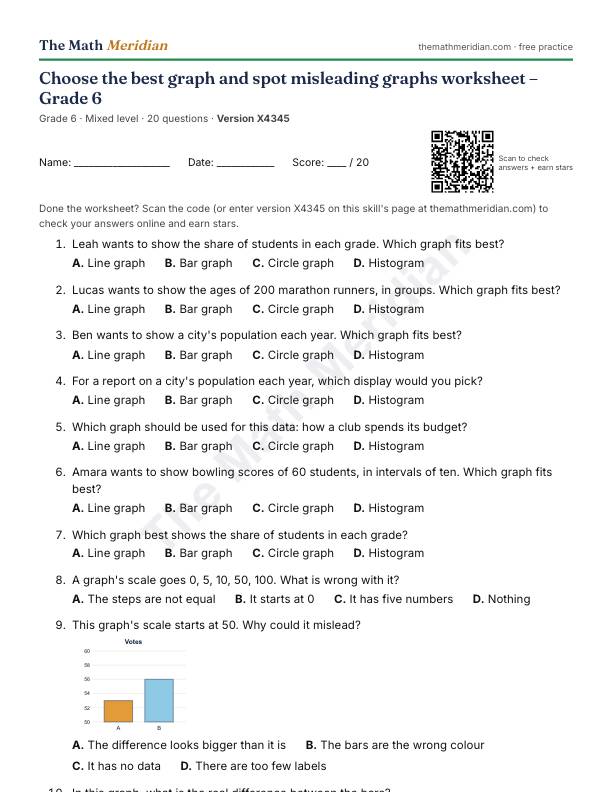
Free printable PDF: Choose the best graph and spot misleading graphs worksheet (Grade 6)
20 questions from easy to hard, with an answer key on the last page. Print it, then scan the QR code on the sheet to check the answers online and earn stars.
Download the PDF worksheetWant a different version? Use Printable worksheet above for a new set of questions every time.
Worked examples: Choose the best graph and spot misleading graphs
Try each one first, then open the solution.
-
Easy
Which graph best shows the ages of 200 marathon runners, in groups?
Choices: Line graph · Bar graph · Circle graph · Histogram
Show the solution
Answer: Histogram
It shows grouped number data.
-
Medium
A graph's scale goes 0, 10, 20, 100, 200. What is wrong with it?
Choices: The steps are not equal · It starts at 0 · It has five numbers · Nothing
Show the solution
Answer: The steps are not equal
Equal space must stand for equal amounts.
-
Hard
Why is a line graph a poor choice for favourite colours?
Choices: The categories have no order over time · Colours cannot be counted · There are too many colours · Line graphs need percents
Show the solution
Answer: The categories have no order over time
Joining the points would suggest a change that is not there.