Histograms and frequency tables worksheet – Grade 7
Questions at easy, medium and hard levels. Pick a level and get a fresh set every time, with instant feedback.
How to solve histograms and frequency tables questions
Learn it A frequency table counts values in intervals, and a histogram draws those counts. To estimate a mean from intervals, use each interval's midpoint.
Example: 5 values are in the 10–19 interval.
- The midpoint is 14.5.
- Estimate their total: 5 × 14.5 = 72.5.
- Repeat for each interval, add, and divide by how many.
Loading questions…
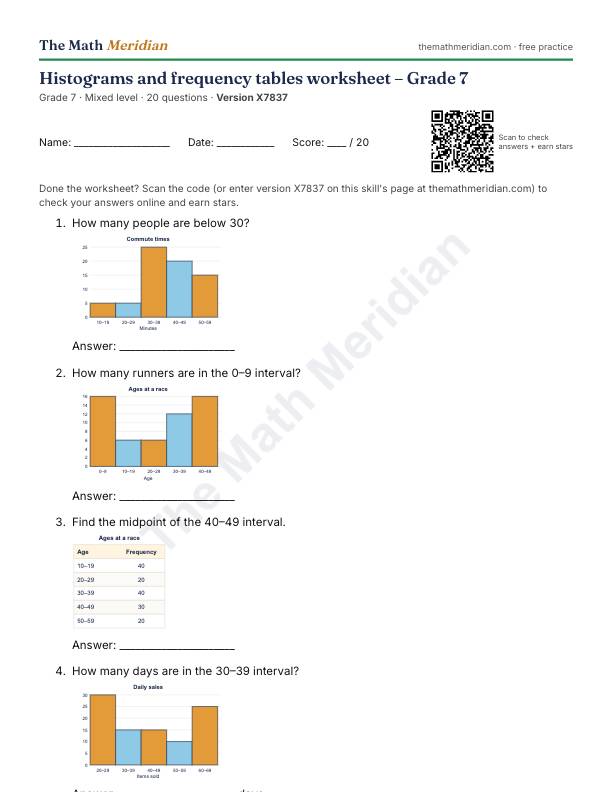
Free printable PDF: Histograms and frequency tables worksheet (Grade 7)
20 questions from easy to hard, with an answer key on the last page. Print it, then scan the QR code on the sheet to check the answers online and earn stars.
Download the PDF worksheetWant a different version? Use Printable worksheet above for a new set of questions every time.
Worked examples: Histograms and frequency tables
Try each one first, then open the solution.
-
Easy
How many days are there altogether?
Show the solution
Answer: 95
40 + 5 + 5 + 25 + 20 = 95.
-
Medium
What percent of the runners are in the 70–79 interval, to the nearest percent?
Show the solution
Answer: 32%
40 ÷ 125 × 100.
-
Hard
Using midpoints, estimate the mean to one decimal place.
Show the solution
Answer: 59.5
Multiply each midpoint by its frequency, add, and divide by 112: about 59.5.
Histograms and frequency tables: questions parents ask
What is the difference between a histogram and a bar graph?
A histogram shows numerical data grouped into intervals, such as ages 10–19 and 20–29, so its bars touch with no gaps. A bar graph shows separate categories, such as favourite fruits, so its bars have gaps between them.
What is a frequency table?
A table that shows how many data values fall in each interval or category. Tally marks help with the counting, and the frequency column shows each total.
How do you choose the intervals?
Make them equal in width and make sure they don't overlap, for example 0–9, 10–19, 20–29. Together they must cover every value from the smallest to the largest.
How do you make a histogram?
Make a frequency table first. Then draw the intervals along the horizontal axis, the frequency up the vertical axis with an even scale starting at 0, draw one bar per interval with no gaps, and add a title and axis labels.
What can you read from a histogram?
How many values are in each interval, the total number of values (add all the frequencies), and the interval with the most values (the tallest bar). You can't read exact individual values, because they are grouped.
Is this worksheet free, with answers?
Yes. The printable PDF has an answer key, and the online practice gives instant feedback, free and with no sign-up.