Back to Data and Probability
Stem-and-leaf plots and line plots worksheet – Grade 7
Questions at easy, medium and hard levels. Pick a level and get a fresh set every time, with instant feedback.
How to solve stem-and-leaf plots and line plots questions
Learn it Both displays keep every value, so you can find the median, mode and range directly. Count to the middle for the median.
Example: A stem-and-leaf plot has 9 values.
- The median is the 5th value.
- Count along the leaves in order.
- Read that value using the key.
Loading questions…
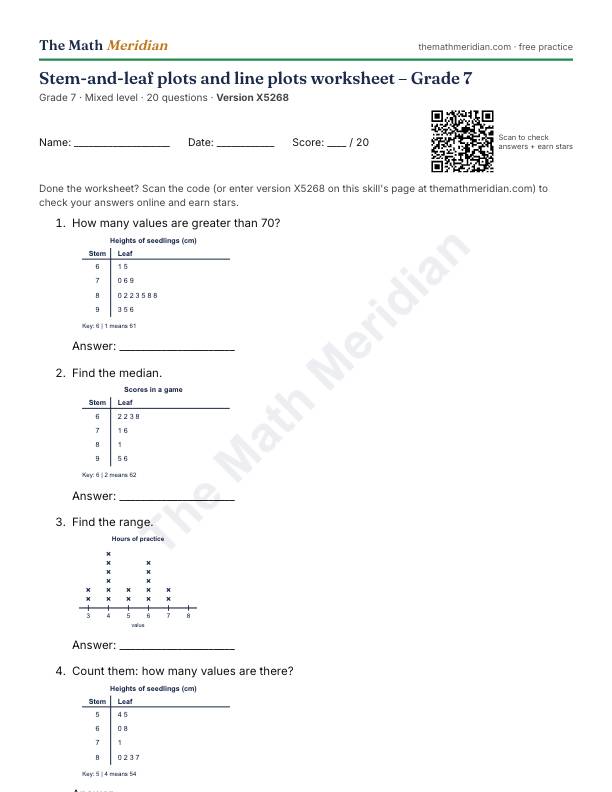
Free printable PDF: Stem-and-leaf plots and line plots worksheet (Grade 7)
20 questions from easy to hard, with an answer key on the last page. Print it, then scan the QR code on the sheet to check the answers online and earn stars.
Download the PDF worksheetWant a different version? Use Printable worksheet above for a new set of questions every time.
Worked examples: Stem-and-leaf plots and line plots
Try each one first, then open the solution.
-
Easy
How many values are greater than 70?
Show the solution
Answer: 12
Count the leaves after 70.
-
Medium
What percent of the values are 22 or less, to the nearest percent?
Show the solution
Answer: 64%
7 out of 11.
-
Hard
What percent of the values are 8 or more, to the nearest percent?
Show the solution
Answer: 48%
13 out of 27.