Compare data sets with mean absolute deviation worksheet – Grade 7
Questions at easy, medium and hard levels. Pick a level and get a fresh set every time, with instant feedback.
How to compare data sets with mean absolute deviation
Learn it The mean tells you the centre of a data set and the mean absolute deviation (MAD) tells you how spread out it is. A smaller MAD means more consistent values. To compare two groups with similar spread, divide the difference between their means by the MAD: a result of 2 or more means the groups are clearly different.
Example: Team A's mean score is 62 and Team B's is 70. Both have a MAD of 4. How many MADs apart are the means?
- Difference between the means: 70 − 62 = 8.
- 8 ÷ 4 = 2.
- The means are 2 MADs apart, so Team B tends to score clearly higher.
Loading questions…
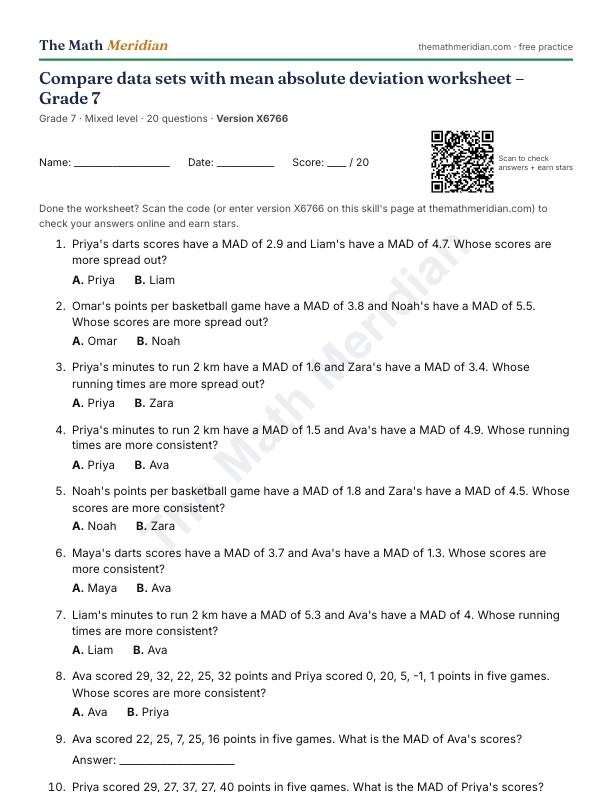
Free printable PDF: Compare data sets with mean absolute deviation worksheet (Grade 7)
20 questions from easy to hard, with an answer key on the last page. Print it, then scan the QR code on the sheet to check the answers online and earn stars.
Download the PDF worksheetWant a different version? Use Printable worksheet above for a new set of questions every time.
Worked examples: Compare data sets with mean absolute deviation
Try each one first, then open the solution.
-
Easy
Noah's points per basketball game have a MAD of 1.9 and Zara's have a MAD of 5.3. Whose scores are more spread out?
Choices: Noah · Zara
Show the solution
Answer: Zara
A larger MAD means the values are further from the mean, so they are more spread out. 5.3 > 1.9, so Zara's scores are more spread out.
-
Medium
Priya scored 5, 7, 18, 15, 15 points and Liam scored 22, 18, 19, 26, 20 points in five games. Whose scores are more consistent?
Choices: Priya · Liam
Show the solution
Answer: Liam
Priya: Mean = (5 + 7 + 18 + 15 + 15) ÷ 5 = 60 ÷ 5 = 12. Distances from the mean: 7, 5, 6, 3, 3. MAD = (7 + 5 + 6 + 3 + 3) ÷ 5 = 24 ÷ 5 = 4.8. Liam: Mean = (22 + 18 + 19 + 26 + 20) ÷ 5 = 105 ÷ 5 = 21. Distances from the mean: 1, 3, 2, 5, 1. MAD = (1 + 3 + 2 + 5 + 1) ÷ 5 = 12 ÷ 5 = 2.4. The smaller MAD is Liam's, so Liam's scores are more consistent.
-
Hard
Team A's goals scored: 41, 52, 42, 51, 47, 43. Team B's goals scored: 45, 56, 46, 55, 51, 47. Both have the same MAD. The difference between the means is how many times the MAD?
Show the solution
Answer: 1
Team A: mean 46. Team B: mean 50. Mean = (41 + 52 + 42 + 51 + 47 + 43) ÷ 6 = 276 ÷ 6 = 46. Distances from the mean: 5, 6, 4, 5, 1, 3. MAD = (5 + 6 + 4 + 5 + 1 + 3) ÷ 6 = 24 ÷ 6 = 4. Difference between the means: 50 − 46 = 4. 4 ÷ 4 = 1. That is less than 2, so the groups overlap a lot.