Line and double line graphs worksheet – Grade 6
Questions at easy, medium and hard levels. Pick a level and get a fresh set every time, with instant feedback.
How to solve line and double line graphs questions
Learn it A double line graph shows two sets of data over the same time. Where the lines cross, the two values are equal. Where they are far apart, the gap is large.
Example: Shop A rises from 20 to 50 and Shop B from 30 to 40.
- Shop A rose 50 − 20 = 30.
- Shop B rose 40 − 30 = 10.
- Shop A rose 20 more than Shop B.
Loading questions…
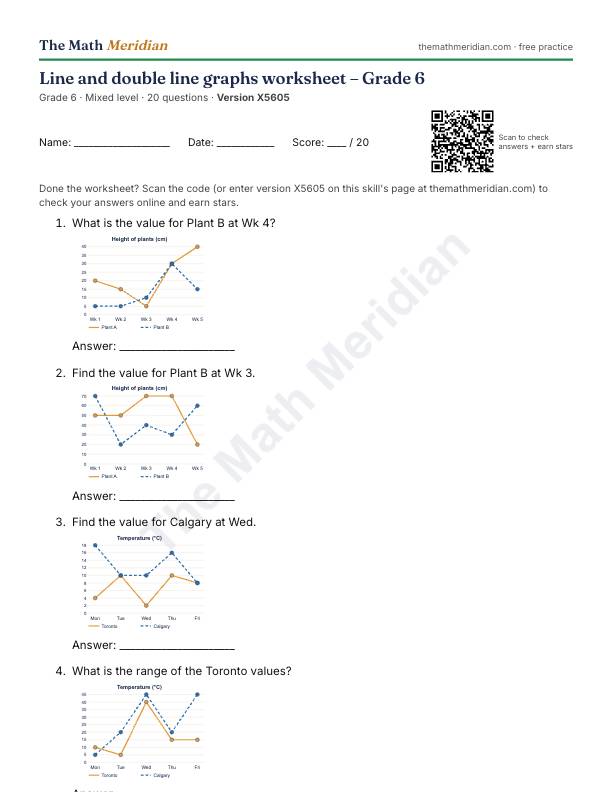
Free printable PDF: Line and double line graphs worksheet (Grade 6)
20 questions from easy to hard, with an answer key on the last page. Print it, then scan the QR code on the sheet to check the answers online and earn stars.
Download the PDF worksheetWant a different version? Use Printable worksheet above for a new set of questions every time.
Worked examples: Line and double line graphs
Try each one first, then open the solution.
-
Easy
At Tue, which line is higher?
Choices: Toronto · Calgary
Show the solution
Answer: Calgary
Toronto 10, Calgary 90.
-
Medium
How much did Plant A change from Wk 2 to Wk 3? Use a minus sign for a drop.
Show the solution
Answer: 0
25 − 25 = 0.
-
Hard
Which line changed more from Mon to Fri, in size?
Choices: Toronto · Calgary
Show the solution
Answer: Calgary
Toronto changed -2, Calgary changed -8.