Histograms worksheet – Grade 6
Questions at easy, medium and hard levels. Pick a level and get a fresh set every time, with instant feedback.
How to solve histograms questions
Learn it A histogram groups numbers into equal intervals. The bars touch because the intervals follow one another. The height shows how many values are in that interval.
Example: The bar for 20–29 reaches 6.
- The interval holds the values 20 to 29.
- The height is 6.
- So 6 values are in the 20s.
Loading questions…
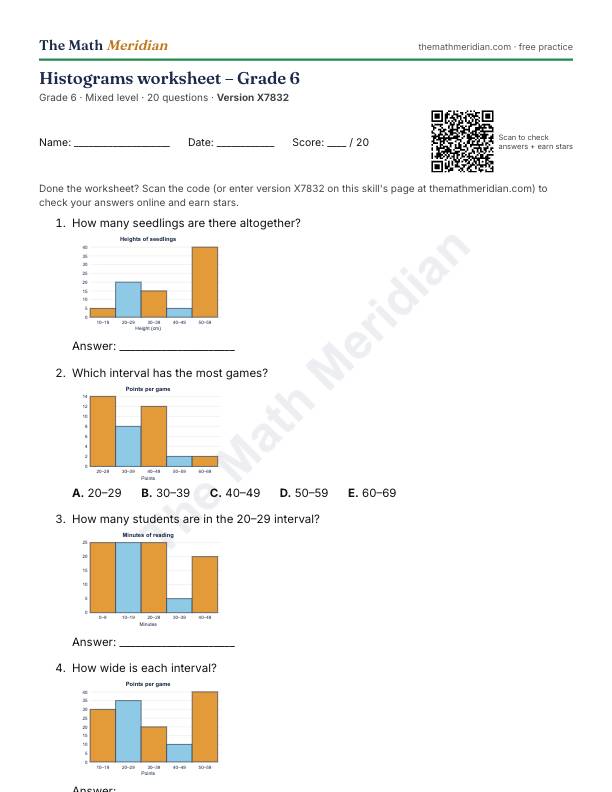
Free printable PDF: Histograms worksheet (Grade 6)
20 questions from easy to hard, with an answer key on the last page. Print it, then scan the QR code on the sheet to check the answers online and earn stars.
Download the PDF worksheetWant a different version? Use Printable worksheet above for a new set of questions every time.
Worked examples: Histograms
Try each one first, then open the solution.
-
Easy
How wide is each interval?
Show the solution
Answer: 10
0–9 covers 10 whole numbers.
-
Medium
Why do the bars of a histogram touch?
Choices: The intervals follow one after another · The data is about categories · There is no space on the page · Each bar is one person
Show the solution
Answer: The intervals follow one after another
The intervals are next to each other on a number scale.
-
Hard
Can you tell the exact highest value from this histogram?
Choices: No, only the interval it is in · Yes, it is the tallest bar · Yes, it is the last number on the axis · Yes, it is the total
Show the solution
Answer: No, only the interval it is in
A histogram groups values, so single values are hidden.