Distance-time and other line graphs worksheet – Grade 8
Questions at easy, medium and hard levels. Pick a level and get a fresh set every time, with instant feedback.
How to solve distance-time and other line graphs questions
Learn it On a distance-time graph the slope is the speed. A flat part means stopped. A steeper part means faster.
Example: A line rises 60 km in 2 hours.
- Speed = distance ÷ time.
- 60 ÷ 2.
- 30 km/h.
Loading questions…
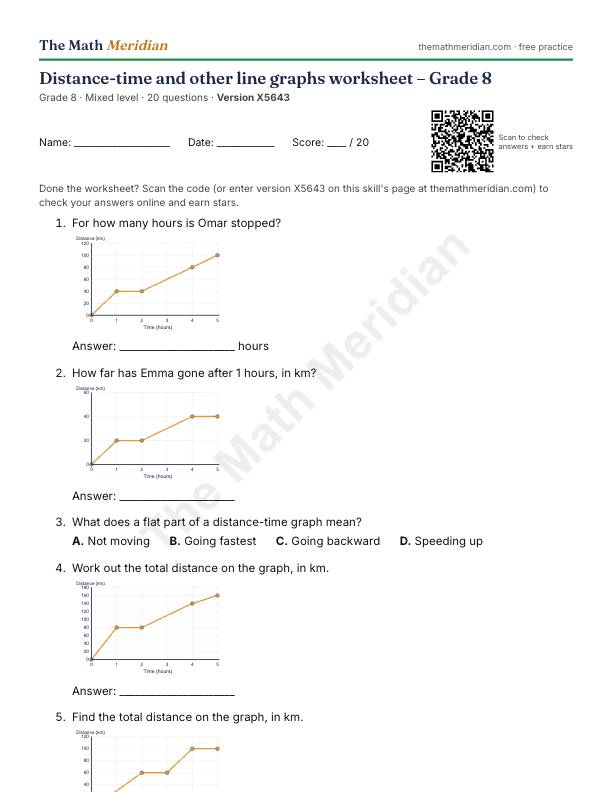
Free printable PDF: Distance-time and other line graphs worksheet (Grade 8)
20 questions from easy to hard, with an answer key on the last page. Print it, then scan the QR code on the sheet to check the answers online and earn stars.
Download the PDF worksheetWant a different version? Use Printable worksheet above for a new set of questions every time.
Worked examples: Distance-time and other line graphs
Try each one first, then open the solution.
-
Easy
What does a flat part of a distance-time graph mean?
Choices: Not moving · Going fastest · Going backward · Speeding up
Show the solution
Answer: Not moving
Time passes but the distance stays the same.
-
Medium
On a distance-time graph, what does a steeper line show?
Choices: A greater speed · A lower speed · A longer stop · A shorter distance
Show the solution
Answer: A greater speed
More distance is covered in the same time.
-
Hard
What does a line sloping down on a distance-from-home graph mean?
Choices: Coming back toward home · Stopping · Moving away faster · Time going backward
Show the solution
Answer: Coming back toward home
The distance from home is getting smaller.