Histograms and relative frequency worksheet – Grade 8
Questions at easy, medium and hard levels. Pick a level and get a fresh set every time, with instant feedback.
How to solve histograms and relative frequency questions
Learn it Relative frequency is a share of the total. Add it up over several intervals to get cumulative percent, and use interval midpoints to estimate a mean.
Example: 12 of 60 people are in an interval.
- 12 ÷ 60 = 0.2.
- 20% of the people.
- The relative frequencies always add to 100%.
Loading questions…
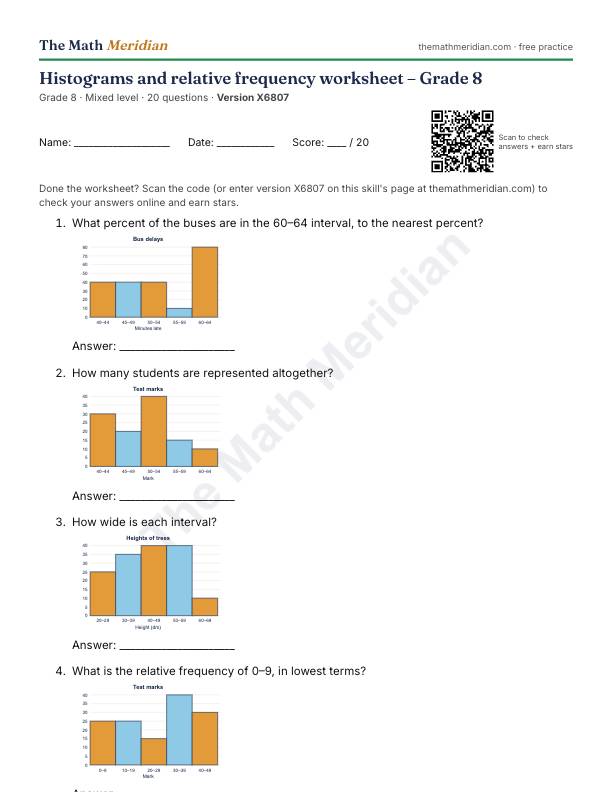
Free printable PDF: Histograms and relative frequency worksheet (Grade 8)
20 questions from easy to hard, with an answer key on the last page. Print it, then scan the QR code on the sheet to check the answers online and earn stars.
Download the PDF worksheetWant a different version? Use Printable worksheet above for a new set of questions every time.
Worked examples: Histograms and relative frequency
Try each one first, then open the solution.
-
Easy
Find the relative frequency of 0–9, in lowest terms.
Show the solution
Answer: 1/9
15/135 = 1/9.
-
Medium
What shape best describes data with most of the bars on the left and a long tail to the right?
Choices: Skewed right · Skewed left · Symmetric · Uniform
Show the solution
Answer: Skewed right
The tail points to the right.
-
Hard
In a data set skewed right, which is usually greater?
Choices: The mean · The median · They are always equal · The minimum
Show the solution
Answer: The mean
The long right tail pulls the mean up.