Scatter plots: trends, outliers and predictions worksheet – Grade 8
Questions at easy, medium and hard levels. Pick a level and get a fresh set every time, with instant feedback.
How to solve scatter plots: trends, outliers and predictions questions
Learn it Look for a trend: going up is a positive association, going down is negative, and no pattern means none. A line of best fit lets you predict, but a trend does not prove one thing causes another.
Example: The line of best fit is y = 3x + 10.
- For x = 20: y = 3 × 20 + 10.
- y = 70.
- This is a prediction, not an exact value.
Loading questions…
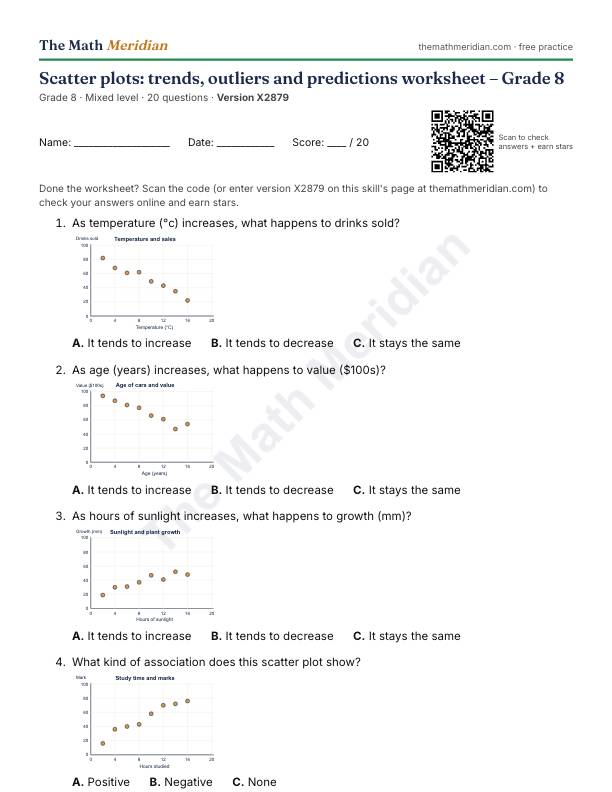
Free printable PDF: Scatter plots: trends, outliers and predictions worksheet (Grade 8)
20 questions from easy to hard, with an answer key on the last page. Print it, then scan the QR code on the sheet to check the answers online and earn stars.
Download the PDF worksheetWant a different version? Use Printable worksheet above for a new set of questions every time.
Worked examples: Scatter plots: trends, outliers and predictions
Try each one first, then open the solution.
-
Easy
What kind of association does this scatter plot show?
Choices: Positive · Negative · None
Show the solution
Answer: Negative
As x goes up, y goes down.
-
Medium
What is an outlier on a scatter plot?
Choices: A point far from the trend · The first point · The highest point · Any point on the line
Show the solution
Answer: A point far from the trend
It does not follow the pattern of the others.
-
Hard
Ice-cream sales and sunburns both rise in summer. What does this show?
Choices: Correlation, not causation · Ice cream causes sunburn · Sunburn causes ice-cream sales · No association
Show the solution
Answer: Correlation, not causation
A third factor, hot sunny weather, affects both.