Choosing displays and spotting misleading data worksheet – Grade 8
Questions at easy, medium and hard levels. Pick a level and get a fresh set every time, with instant feedback.
How to solve choosing displays and spotting misleading data questions
Learn it Pick a display that suits the data, and check that it is fair: scale starts at zero for bars, equal steps, labels on axes, and no data left out.
Example: A line graph has years 2020, 2021, 2023, 2024 equally spaced.
- The gap of two years looks like one.
- The steps are not equal.
- The graph is misleading.
Loading questions…
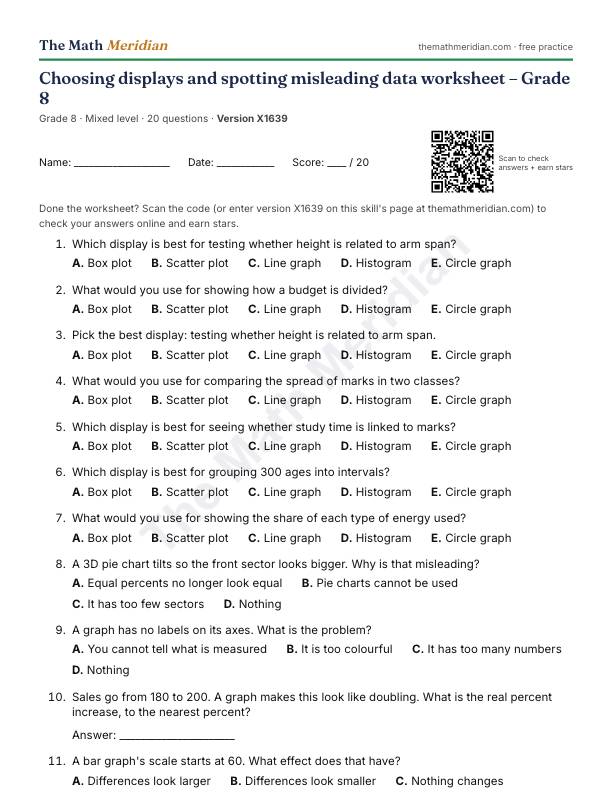
Free printable PDF: Choosing displays and spotting misleading data worksheet (Grade 8)
20 questions from easy to hard, with an answer key on the last page. Print it, then scan the QR code on the sheet to check the answers online and earn stars.
Download the PDF worksheetWant a different version? Use Printable worksheet above for a new set of questions every time.
Worked examples: Choosing displays and spotting misleading data
Try each one first, then open the solution.
-
Easy
Which display is best for showing the median and quartiles of race times?
Choices: Box plot · Scatter plot · Line graph · Histogram · Circle graph
Show the solution
Answer: Box plot
It shows median, quartiles and spread.
-
Medium
A 3D pie chart tilts so the front sector looks bigger. Why is that misleading?
Choices: Equal percents no longer look equal · Pie charts cannot be used · It has too few sectors · Nothing
Show the solution
Answer: Equal percents no longer look equal
The tilt distorts the areas.
-
Hard
A company reports the mean salary, and one boss earns far more than the rest. Which is the fairer average?
Choices: The median · The mean · The maximum · The range
Show the solution
Answer: The median
One very large value pulls the mean up.